

Latency Surgeon: Profiling and Fixing Latency in LLM Inference Pipelines

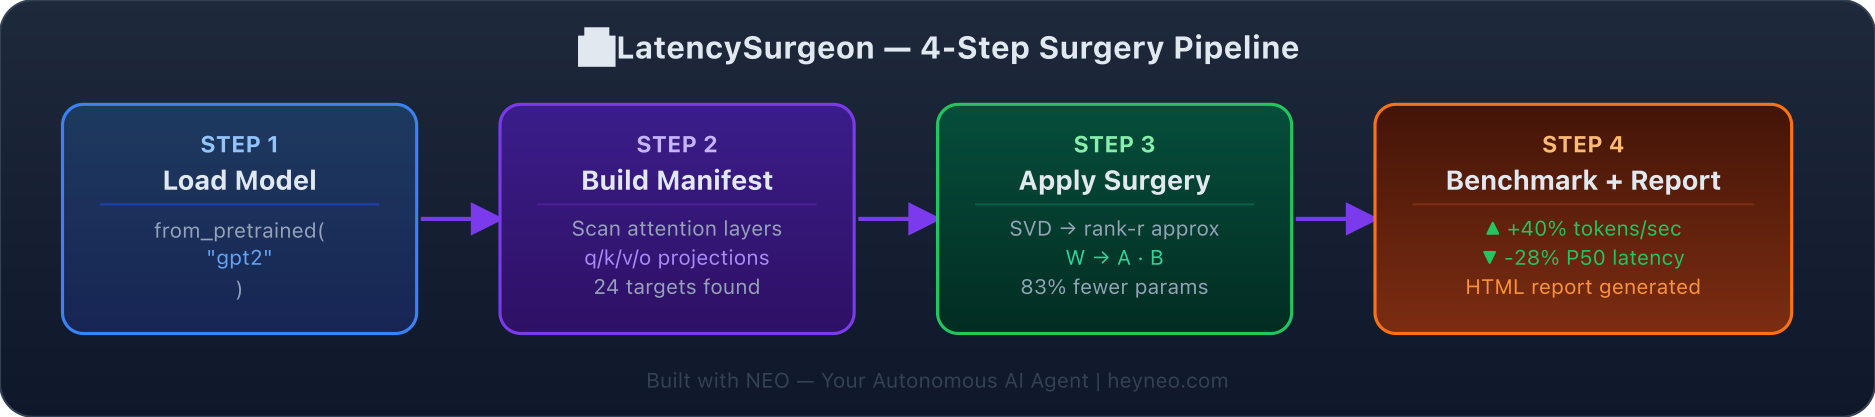 Pipeline Architecture
The Problem
When an LLM inference pipeline is slow, it is rarely obvious why. Is it prompt encoding? KV cache misses? Attention scaling with context length? Slow post-processing? Without instrumentation, you are guessing.
NEO built Latency Surgeon to remove the guesswork: it hooks into every stage of an LLM inference pipeline, measures wall-clock time at each step, and produces a flame-graph-style breakdown that shows exactly where time is going — along with targeted optimization suggestions based on what it finds.
Stage-Level Instrumentation
Latency Surgeon instruments six pipeline stages that together account for virtually all inference latency:
- Prompt Encoding — tokenization time, including special token injection and attention mask construction
- KV Cache Lookup — time spent checking whether prefix tokens already have cached key/value pairs
- Prefill — the forward pass over input tokens to populate the KV cache
- Attention Computation — per-layer attention time, measured separately via CUDA events when GPU is available
- Decoding — autoregressive token generation, including sampling
- Post-Processing — detokenization, output parsing, function call extraction, and any downstream formatting
Instrumentation is injected via a wrapper around the model's generate() call for HuggingFace models, and via a proxy layer for OpenAI-compatible API servers (vLLM, llama.cpp server, Ollama). For cloud APIs, only the stages visible from the client side (time-to-first-token, inter-token latency, post-processing) are measured.
Each request produces a LatencyProfile object with per-stage timings in milliseconds, plus derived metrics: time-to-first-token (TTFT), tokens-per-second during decoding, and end-to-end latency.
Flame Graph and Context Length Sensitivity Analysis
The primary visualization is a flame-graph-style chart rendered using Plotly. Each stage is a horizontal bar whose width is proportional to its share of total latency. Nested within each bar are sub-components — for attention computation, that means per-layer breakdowns when layer-level timing is available.
latency-surgeon profile \
  --model ./models/mistral-7b-instruct-Q4_K_M.gguf \
  --input-file prompts.jsonl \
  --output latency_report.html
A second analysis mode sweeps context length from 128 to the model's maximum and plots how each stage's latency scales. This makes attention complexity (O(n²) scaling in vanilla transformers) immediately visible as a curve inflection in the attention stage, and distinguishes it from KV cache effects that show up earlier as a step change at specific cache size thresholds.
The output HTML report embeds all charts and includes a raw data table with per-request stage timings, sortable by any column.
Automated Optimization Recommendations
After profiling, Latency Surgeon runs a diagnose step that applies a rule set to the collected data and generates prioritized optimization recommendations:
| Finding | Recommendation |
|---|---|
| KV cache miss rate > 30% | Enable prefix caching; consider prompt compression for repeated system prompt |
| Attention stage > 50% of latency at context > 2K | Enable Flash Attention 2 or chunked prefill |
| TTFT > 2s with short prompts | Speculative decoding with a smaller draft model |
| Decoding tok/s < 10 on GPU | Check batch size; consider continuous batching |
| Post-processing > 15% of latency | Move output parsing off the critical path using async post-processing |
Each recommendation includes the specific configuration change or code snippet needed to apply it, along with an estimated latency reduction based on benchmarks from the repository's reference suite.
from latency_surgeon import LatencySurgeon

surgeon = LatencySurgeon(model_path="./mistral-7b-Q4_K_M.gguf")
profile = surgeon.profile(prompts=my_prompts, n_runs=50)
recommendations = surgeon.diagnose(profile)

for rec in recommendations:
    print(f"[{rec.priority}] {rec.finding}: {rec.action}")
    print(f"  Estimated improvement: {rec.estimated_savings_ms}ms per request")
How to Build This with NEO
Open NEO in VS Code or Cursor and describe what you want to build. A good starting prompt for this project:
"Build a Python profiling tool called Latency Surgeon that instruments LLM inference pipelines at six stages: prompt encoding, KV cache lookup, prefill, attention computation, decoding, and post-processing. Support HuggingFace generate() wrappers and OpenAI-compatible API proxies. Produce a flame-graph-style HTML report using Plotly showing per-stage latency breakdown. Include a context length sensitivity sweep and a diagnose command that applies optimization rules to the profile data and outputs prioritized recommendations with estimated latency savings."
NEO generates the project structure and core implementation. From there you iterate — ask it to add continuous profiling mode that samples latency in production traffic, build per-model benchmark comparisons across quantization levels, or extend the recommendation engine with A/B testing to validate that suggested optimizations actually reduce latency. Each request builds on what's already there.
To run the finished project:
git clone https://github.com/dakshjain-1616/latency-surgeon
cd latency-surgeon
pip install -r requirements.txt
python -m latency_surgeon profile --model ./your-model.gguf --input prompts.jsonl
The tool runs your prompt set through the instrumented pipeline and opens a browser with the flame-graph report and optimization recommendations.
NEO built a six-stage LLM inference profiler that produces flame-graph latency breakdowns and automated optimization recommendations targeting KV cache misses, attention scaling, and post-processing bottlenecks. See what else NEO ships at heyneo.com.
Try NEO in Your IDE
Install the NEO extension to bring AI-powered development directly into your workflow:
- VS Code: NEO in VS Code
- Cursor: Install NEO for Cursor