

Context Cost Map: Visualizing Token Spend Across Your LLM Pipeline

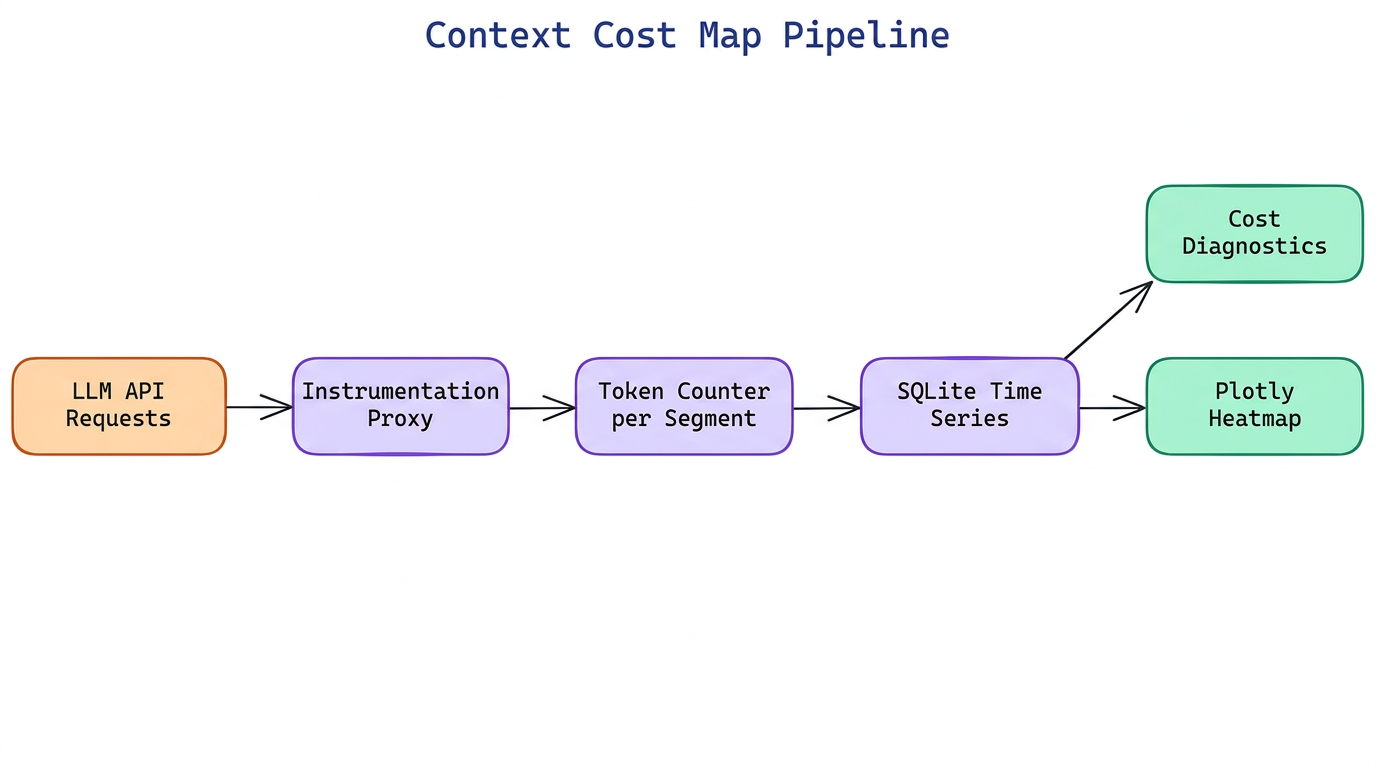 Pipeline Architecture
The Problem
Teams running production LLM pipelines often have no idea which part of their context window is actually influencing model outputs and which part is burning tokens for nothing.
NEO built Context Cost Map to make token spend visible: it instruments every stage of an LLM pipeline and renders an interactive heatmap broken down by source (system prompt, retrieved chunks, conversation history, tool results, model output), model, and time period — so teams can find and eliminate expensive context that is not contributing to output quality.
Pipeline Instrumentation
Context Cost Map wraps LLM calls through a thin instrumentation layer. For OpenAI-compatible APIs, it intercepts requests via a proxy class. For LangChain and LlamaIndex pipelines, it registers as a callback handler. Each intercepted call records the token count per context segment using the model's tokenizer (tiktoken for GPT models, the HuggingFace tokenizer for others) before the request is sent.
Context segments are classified automatically by inspecting the message structure:
system— the system prompt blockretrieved_context— content tagged with RAG metadata or matching retrieval patternshistory— prior user/assistant turns beyond the current exchangetool_results— function call return valuesuser_input— the current user messageassistant_output— the model's response tokens
Each call record is written to a time-series store (SQLite locally, configurable to Postgres for production) with timestamp, model name, pipeline stage label, and per-segment token counts. Dollar cost is computed by applying the model's per-token pricing from a bundled pricing table that covers GPT-4o, Claude 3 and 3.5 series, Gemini 1.5, and Mistral models.
Interactive Heatmap Rendering
The visualization layer reads from the token store and renders an interactive heatmap using Plotly. The default view shows token spend on the Y-axis (broken down by segment type) and time on the X-axis, with color intensity representing cost density. Hovering a cell shows the exact token count, dollar cost, and the five most expensive individual context chunks from that segment in that time window.
Filters let you slice by model, pipeline stage, time range, or segment type. A secondary view renders a stacked bar chart comparing the contribution of each segment type to total cost across pipeline stages — useful for spotting cases where retrieved context is dominating the context window without a corresponding improvement in output quality.
# Start the dashboard
context-cost-map serve --db ./pipeline_tokens.db --port 8080

# Export a snapshot report
context-cost-map report --period 7d --format html --output report.html
The export command produces a self-contained HTML file with all charts embedded, suitable for sharing with stakeholders who do not have access to the dashboard server.
Identifying and Eliminating Expensive Context
Beyond visualization, Context Cost Map includes a diagnose command that runs a statistical analysis over the token store and surfaces optimization candidates. It computes correlation between segment token counts and output quality scores (if a quality signal is provided) and flags segments where the correlation is near zero — indicating that trimming that segment is unlikely to hurt output quality.
Common findings the tool surfaces:
- System prompts that have grown to 2,000+ tokens through incremental additions, where ablation shows no quality impact from removing 60% of the content
- Retrieved context chunks that are consistently retrieved but never referenced in the model's output (detected via grounding analysis)
- Conversation history windows that extend 20+ turns when 90% of quality signal comes from the last 5 turns
context-cost-map diagnose --db ./pipeline_tokens.db --quality-signal ./eval_scores.json
How to Build This with NEO
Open NEO in VS Code or Cursor and describe what you want to build. A good starting prompt for this project:
"Build a Python tool called Context Cost Map that instruments LLM pipelines and produces interactive heatmaps of token spend. Intercept OpenAI-compatible API calls and LangChain callbacks to record per-segment token counts (system prompt, retrieved context, conversation history, tool results, user input, model output). Store records in SQLite with timestamps and compute dollar costs using a bundled pricing table. Build a Plotly dashboard that renders token spend heatmaps by segment type and time, and include a diagnose command that flags context segments with near-zero correlation to output quality."
NEO generates the project structure and core implementation. From there you iterate — ask it to add Postgres support for production deployments, build budget alerting when daily token spend exceeds a threshold, or extend the grounding analysis to detect hallucinated citations. Each request builds on what's already there.
To run the finished project:
git clone https://github.com/dakshjain-1616/Context-cost-map
cd Context-cost-map
pip install -r requirements.txt
python -m context_cost_map serve --port 8080
Wrap your existing LLM calls with the instrumentation layer and navigate to localhost:8080 to see live token spend broken down by segment, model, and pipeline stage.
NEO built a token instrumentation and visualization tool that maps context spend across LLM pipeline stages and identifies which context segments can be trimmed without impacting output quality. See what else NEO ships at heyneo.com.
Try NEO in Your IDE
Install the NEO extension to bring AI-powered development directly into your workflow:
- VS Code: NEO in VS Code
- Cursor: Install NEO for Cursor